


19 Fatalities in less than 3 months

You need to clear a bit of the clutter.
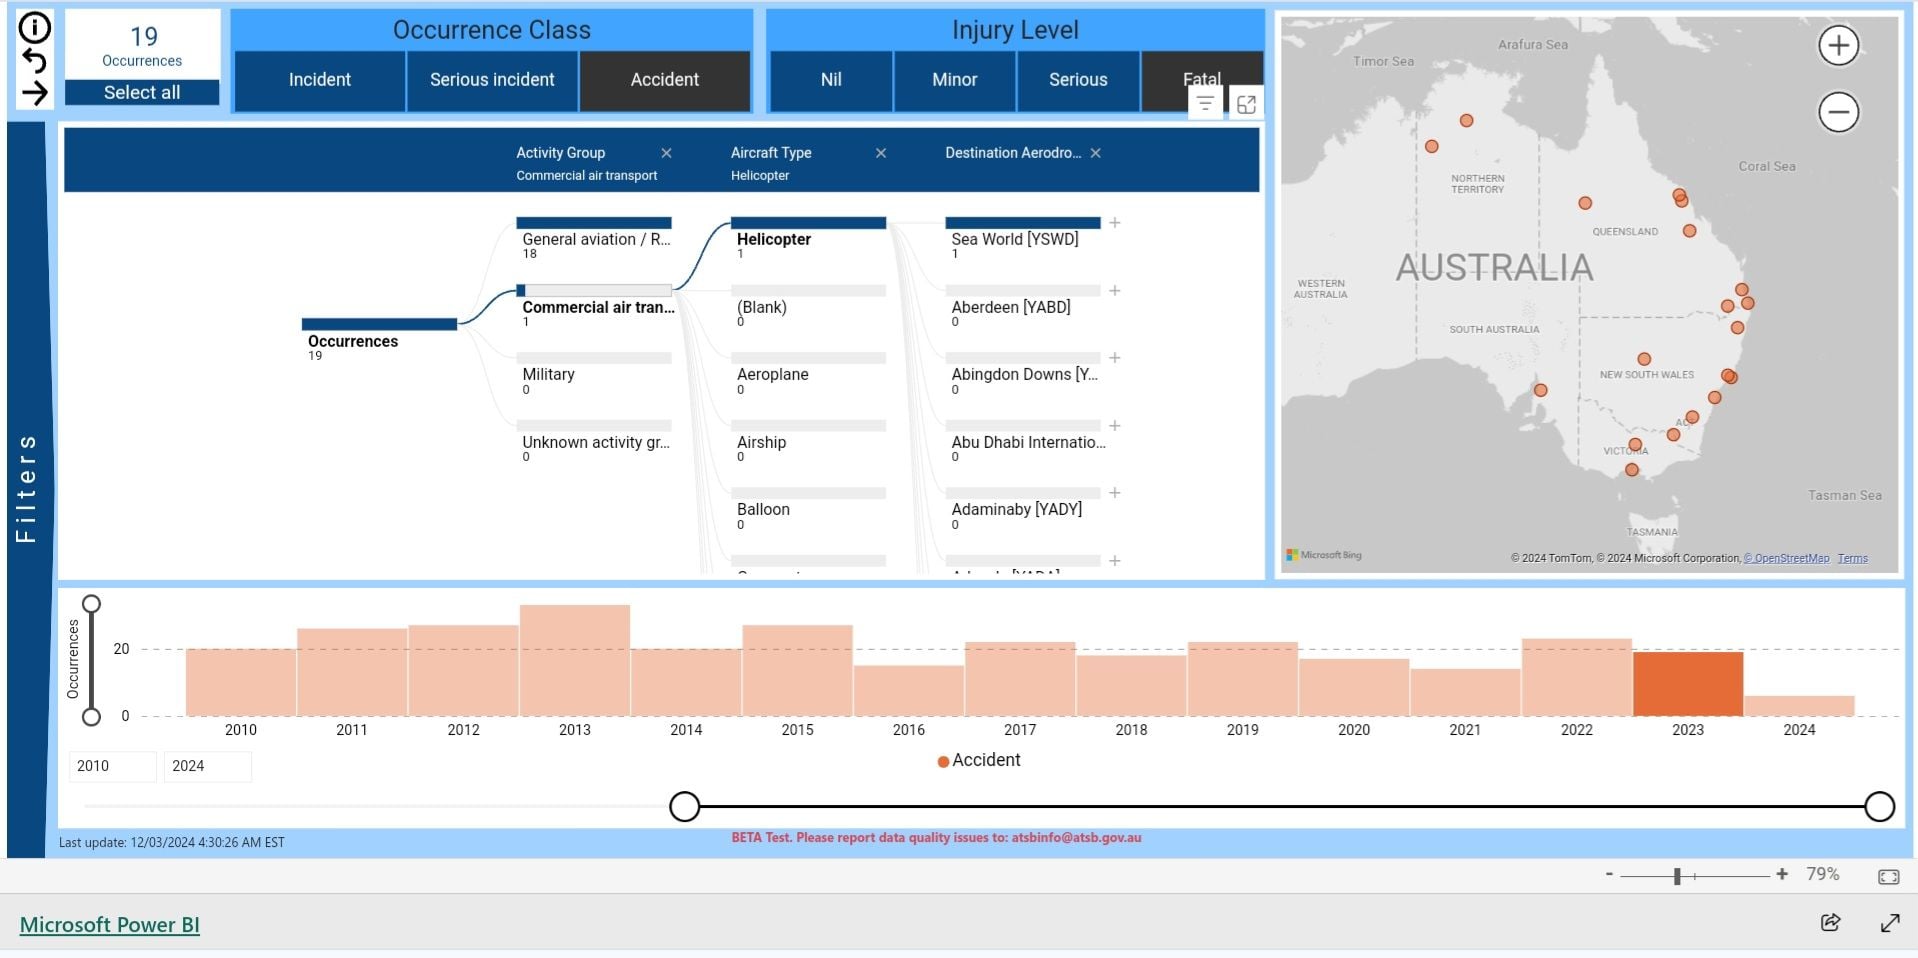
Under Occurrence Class, select Accident. Under Injury Level, select Fatal. Down on the timeline, select 2023. The result should be 19 occurrences in total, and you'll then be able to see an occurrence marked on the map near Southport.
If you then clean up the filters and select Activity > Aircraft Type > Destination Airport, you can see the Sea World crash has been categorised under Commercial Air Transport.
So where does it specify the number of fatalities in that accident?

Thread Starter
Remember that the USA has a population of over 341 million people compared to Australia�s 26.6 million. Over that 3 month time period, Australia�s 19 fatalities works out at 0.71 fatalities per million people, whereas the USA works out at 0.16 fatalities per million people. In other words, Australia had over 4 times as many fatalities per capita as the USA.

The following users liked this post:
I agree with Dick in part, not because of relative population, but in regard to relative Aviating population. The number of active pilots at all levels in the USA, the amount and density of traffic and airports, military airspace, weather phenomenon, elevation, and so on is far above Australias pitiful aviation scene. Australia should have an accident rate 1/10th that of the USA, but it does not. I do blame in part the rule set and abomination of what is Australias regulator and government decisions in relation to Aviation infrastructure. Safe skies are empty skies as far as Australia is concerned.
The following 3 users liked this post by 43Inches:
Mick.....the information is there.........accessing it is the trick.
Once you get to the Sea World (YSWD) blue bar under the destination aerodrome selection, right clicking the blue bar will present you with a --> goto Drill through --> Data Table and that provides information on the accident (eg., fatalities).
Once you get to the Sea World (YSWD) blue bar under the destination aerodrome selection, right clicking the blue bar will present you with a --> goto Drill through --> Data Table and that provides information on the accident (eg., fatalities).
The state of GA regulation
I agree with Dick in part, not because of relative population, but in regard to relative Aviating population. The number of active pilots at all levels in the USA, the amount and density of traffic and airports, military airspace, weather phenomenon, elevation, and so on is far above Australias pitiful aviation scene. Australia should have an accident rate 1/10th that of the USA, but it does not. I do blame in part the rule set and abomination of what is Australias regulator and government decisions in relation to Aviation infrastructure. Safe skies are empty skies as far as Australia is concerned.
Then there�s all the invented permissions for which CASA charges exorbitant fees and the wrong principle that the independent regulator should recoup a large proportion of its expenses from the industry.
Last edited by Sandy Reith; 12th Mar 2024 at 03:22.
No more strange than the US recording 99 fatalities from 66 accidents for the September quarter last year while, for the same period, we recorded 2 fatalities from 1 accident (3 from 2 if you include the G-2468 homebuilt gyrocopter crash).
So 1.19 per million people for the US, 1.20 for Australia.
Using flight hours flown for GA - USA 10.3 per million flight hours, Australia 8.5 per million (graph on page 12).
Surely it's the number (and type) of accidents that result in fatalities, rather than just the bald number of fatalities that is the important metric if you are trying to discuss (or imply) systemic failures?
For the decade 2010-2019 the US suffered an average GA fatality rate per year of 405, Australia 32.
So 1.19 per million people for the US, 1.20 for Australia.
Using flight hours flown for GA - USA 10.3 per million flight hours, Australia 8.5 per million (graph on page 12).
So 1.19 per million people for the US, 1.20 for Australia.
Using flight hours flown for GA - USA 10.3 per million flight hours, Australia 8.5 per million (graph on page 12).
I am getting a sense of d�j� vu all over again with this topic. I'm sure it has been kicked around in the past with some discussion about the higher percentage of instrument rated pilots in the GA community in the US when compared to Australia.
Last edited by MickG0105; 12th Mar 2024 at 05:41.
As a thought would 1 October to 19 December being spring and summer in Australia mean more recreational flying happening vs the start of winter in the US, therefore more flying activity?
Mick.....the information is there.........accessing it is the trick.
Once you get to the Sea World (YSWD) blue bar under the destination aerodrome selection, right clicking the blue bar will present you with a --> goto Drill through --> Data Table and that provides information on the accident (eg., fatalities).
Once you get to the Sea World (YSWD) blue bar under the destination aerodrome selection, right clicking the blue bar will present you with a --> goto Drill through --> Data Table and that provides information on the accident (eg., fatalities).
If the number of passengers killed in commercial helicopter operations in the last few years are statistically irrelevant, I wonder why we bother with ATSB. Just wait until the statisticians decides there's some statistically relevant trend and then arc up an investigation.
Bottomline is that you need to careful when comparing statistics, very much more so when you start looking at smaller subsets.
Mick.....the information is there.........accessing it is the trick.
Once you get to the Sea World (YSWD) blue bar under the destination aerodrome selection, right clicking the blue bar will present you with a --> goto Drill through --> Data Table and that provides information on the accident (eg., fatalities).
Once you get to the Sea World (YSWD) blue bar under the destination aerodrome selection, right clicking the blue bar will present you with a --> goto Drill through --> Data Table and that provides information on the accident (eg., fatalities).
The following users liked this post:
LB said:
I'm in total agreement LB. The ATSB Database is user-unfriendly and not at all straightforward to use or query, and I'm really not sure why it needed to be that way.
Shouldn't need right clicking and 'drill throughs' or clearing of a bit of 'clutter' or whatever to get to the number of people whose lives were lost in a tragedy.
If the number of passengers killed in commercial helicopter operations in the last few years are statistically irrelevant, I wonder why we bother with ATSB. Just wait until the statisticians decides there's some statistically relevant trend and then arc up an investigation.
If the number of passengers killed in commercial helicopter operations in the last few years are statistically irrelevant, I wonder why we bother with ATSB. Just wait until the statisticians decides there's some statistically relevant trend and then arc up an investigation.
The following users liked this post:
A statistician would say that each event is mutually exclusive, however that is definitely not the case when you�re talking about aircraft manufacturers and operators of said aircraft with pilots and moving parts.
